Research News
“Time in the market beats timing the market” rather than “Sell in May” One possible difference from previous summer lulls: structural megatrends are creating a fundamentally new basis for growth that could defy short-term seasonality. The five largest hyperscalers will invest around US$520 billion in AI infrastructure by 2026 — a 30% increase on 2025. BlackRock concludes: AI “trumps tariffs and traditional macro drivers”. JPMorgan warns that the greatest risk is not investing in this transformation. BNP Paribas identifies AI infrastructure, autonomous agents and regulatory beneficiaries as eight key investment themes for 2026. Industrial automation is accelerating — driven by labour shortages, rising wage costs and geopolitically motivated waves of reshoring. We see long-term earnings potential here, particularly in the private equity technology sector. Furthermore, digitalisation is enabling emerging market economies to make a developmental leap that bypasses traditional industrial cycles. Globally, trillions of dollars will flow into urban infrastructure, smart mobility systems and energy supply by 2030. We highlight Asian markets here, which are likely to outpace their global counterparts in the expansion of data centre capacity by 2030. Utilities are benefiting from the exploding electricity demand of AI infrastructure. China is expected to grow by around 5 per cent this year, buoyed by government stimulus programmes and a thriving technology sector. We view Chinese technology stocks as the top global opportunity — offering attractive valuations despite strong fundamentals. We see risks in geopolitical developments, volatile US trade policy, and slower-than-expected inflation...
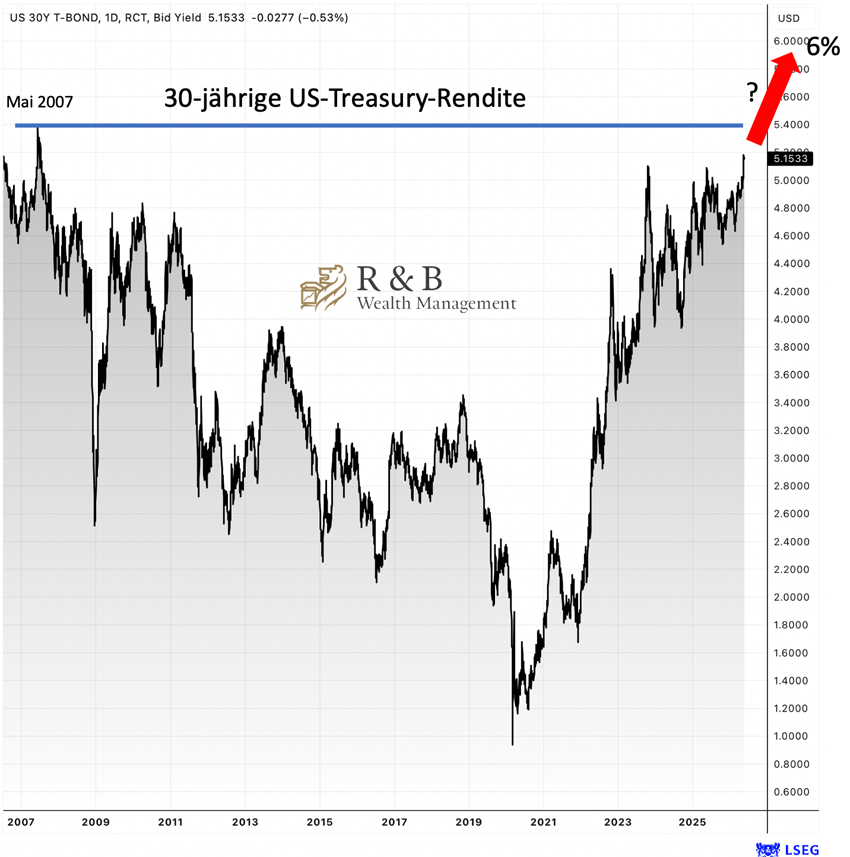
Record US yields at the long end – implications for the US dollar The 30-year US Treasury yield reached 5.197% intraday on 19–20 May 2026 and closed at around 5.18% – its highest level since July 2007. The 10-year German government bond stands at around 3.2%, its highest level since May 2011; the 30-year German government bond yield is accordingly close to or above 3.5%. Globally, long-term yields are rising in unison, whilst short-term yields remain relatively stable – the picture of a bear steepening, i.e. a steepening of the yield curve driven by rising long-term yields. Why are long-term yields so high? Three drivers are at work. Firstly, resurgent inflation due to the Iran conflict (oil >$100/barrel) – in the BofA fund manager survey of May 2026, 40% of respondents cited “second-wave inflation” as the greatest tail risk. Secondly, fiscal concerns: the US credit rating downgraded by Moody’s in May 2025 (Aa1) and spiralling deficits are leading to a higher term premium. Thirdly, central bank credibility and geopolitics. We see a steepening scenario as plausible: risk-off (labour market weakness weighs on the front end) OR risk-on (fiscal expansion drives long-term yields). What is striking: 62% of global fund managers (BofA) expect the 30-year yield to rise to 6% – a level not seen since the end of 1999. Implications for the EUR/USD exchange rate Traditionally, rising US long-term yields...
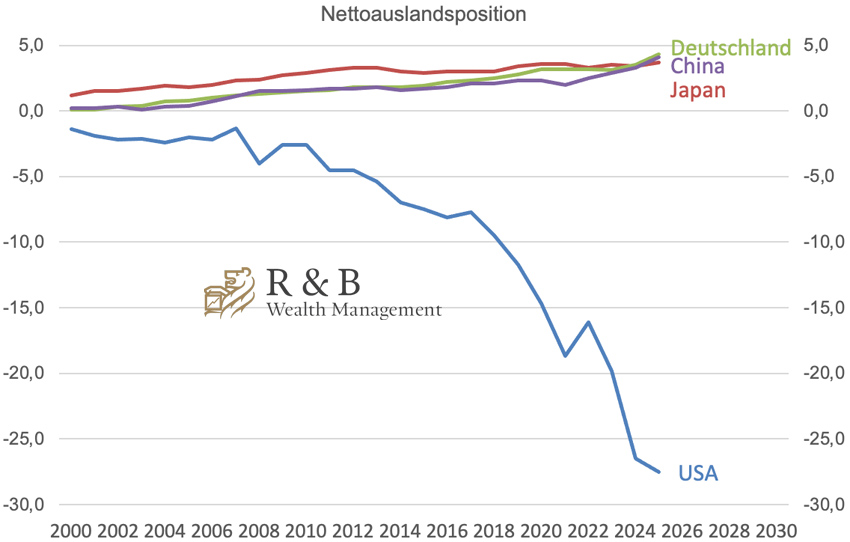
Trump will continue to keep the financial markets on edge and cause unrest with measures designed to raise funds for the US. Investors and economies should expect volatility to be the norm, without allowing themselves to be pushed away from a long-term diversified strategy. The root problem: global imbalances The US net international investment position (NIIP) has deteriorated massively over more than two decades. At the end of 2025, it stood at –$27.5 trillion, or around –88% of GDP (source: BEA, IMF). This is offset by three major net creditors: Germany (+$4.3 trillion), China (+$4.1 trillion) and Japan (+$3.7 trillion). This imbalance has grown steadily over twenty years and cannot be resolved within a few years. Compounding the situation is the fact that Moody’s downgraded the US credit rating from Aaa to Aa1 on 16 May 2025; higher interest rates for refinancing the national debt are the result. The Trump administration’s tools This pressure has given rise to many current policy measures, the common thread of which is the procurement of capital and assets for the US: (1) Tariffs: Tariff revenues rose to around USD 264 billion in 2025 (compared with USD 79 billion in 2024); Estimates range up to USD 2–3 trillion over ten years – albeit with legal risks (Supreme Court); (2) Russia sanctions and energy exports: Europe must source energy (LNG) from the US rather than Russia – a direct boost to the US trade balance...
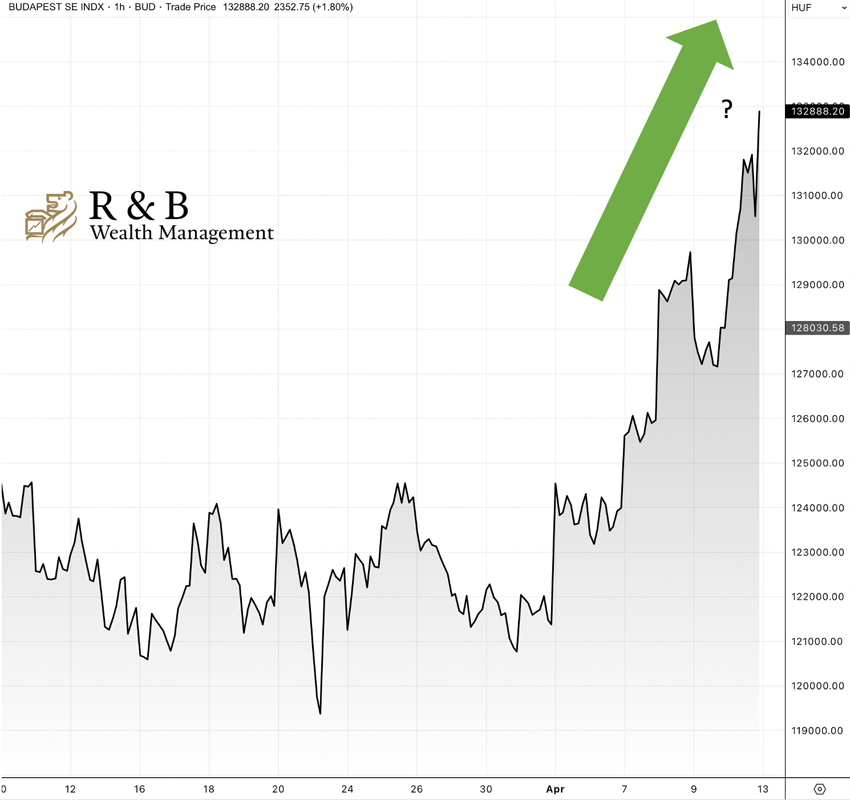
A potential election victory for TISZA would have an indirect positive effect on European stock markets. With just under 82 per cent of votes counted, Magyar’s opposition party TISZA has secured 137 seats, according to the Hungarian electoral authority’s website – 133 are required for a two-thirds majority. Orbán’s Fidesz has secured 55 seats in parliament. For the DAX, CAC 40, EUROSTOXX 50, STOXX 600 and other European indices, a TISZA victory would be more of a moderate boost to sentiment than a major price surge, for the following reasons: Hungary is too small an economy to directly influence European indices. The positive effect would be indirect — through fewer political deadlocks in the EU Council, greater EU unity vis-à-vis Russia, and the signal that right-wing populism is reaching its limits in Europe. This strengthens confidence in EU stability in general, which investors appreciate. The most immediate effect does not concern the major European stock markets, but Hungarian securities: In the event of a clear TISZA election victory, the forint is expected to fall below 370 per euro — a significant gain. Bloomberg reported that traders had already bet heavily on Hungarian market gains ahead of the election. The Hungarian benchmark stock index, the BUX (Budapest Stock Exchange Index – chart), has also risen sharply recently and is likely to extend its gains tomorrow. As for Hungarian government bonds, Barclays upgraded its outlook even before the election...

Gold between two extremes: from heavily overbought to heavily oversold. As we predicted here in early February under the headline: “Even gold doesn’t grow to the sky”, the gold price formed a sharp downward trend following its all-time high of USD 5,588 (31 January 2026). Last week, on its way to recovery, it hit a multi-month low of USD 4,302. Yesterday, the price recovered to a 4-day high of USD 4,617. Following some profit-taking, gold closed at USD 4,576, remaining below the fallen 100-day moving average (currently: USD 4,548) and the broken medium-term upward trend line. The trends in the short-term and medium-term timeframes remain downward. The gold price is now struggling to reclaim the resistance zone at $4,625–$4,680. A daily closing price above this level would improve the prospects of a recovery rally towards $4,750–$4,790. Above that, the next cluster of resistance at USD 4,960–4,995 comes into focus – the zone where the medium-term downtrend was triggered in February. Only a rise above USD 5,000–5,075 would also brighten the medium-term chart picture...

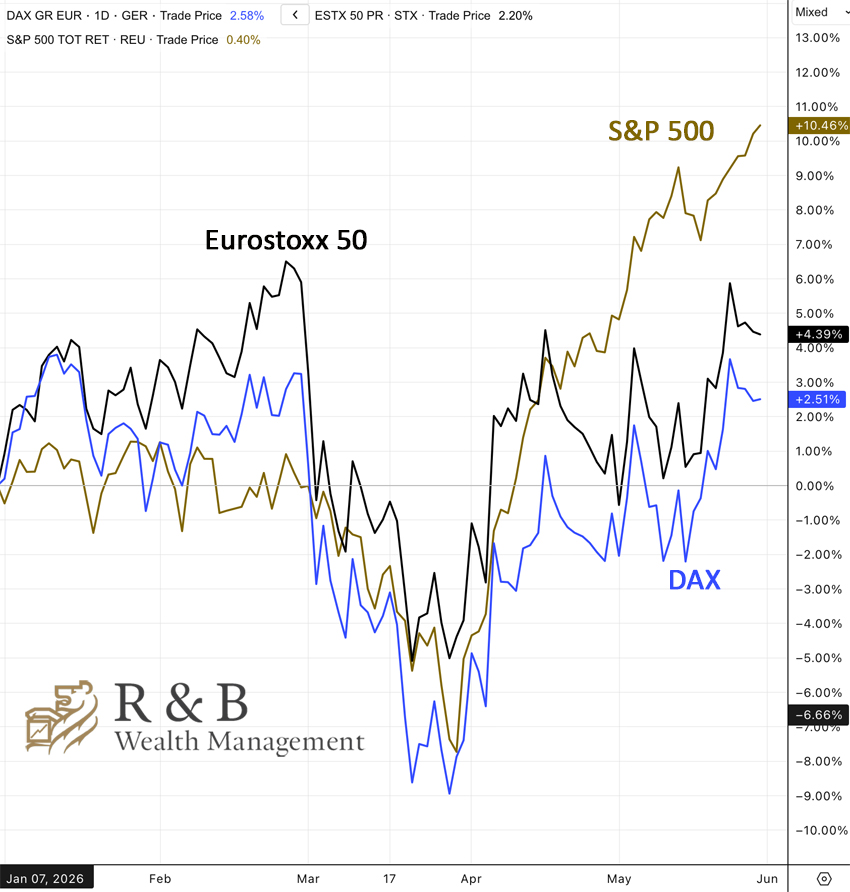
The stock markets' reaction to Trump's ‘America First’ policy is ‘World United’. Contrary to the US President's self-praise: "I took over the country in the worst situation in American history and took just a few months to save it. I ensured that more was invested in the US during this period than in any other region of the world. These investments would never have been made if I had not introduced punitive tariffs," the balance sheet after 14 months paints a different picture, with unsettled companies, collapsing supply chains and a weaker labour market. As a result, the broader MSCI World Index (blue lines) has outperformed the leading US index, the S&P 500 (black lines), since Trump took office, something it had not managed to do for many years. See graph. The sobering conclusion: Trump's trade war is primarily harming America itself, and what he sees as ‘the rest of the world’ has recently intensified its trade relations. The World United.
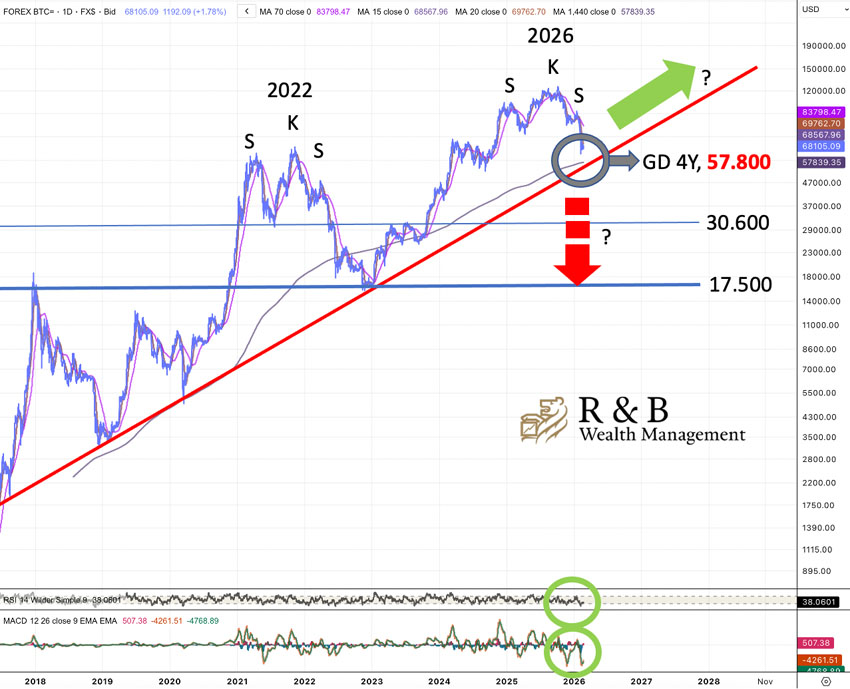
Bitcoin uptrend: Now it counts! Bitcoin is currently trading at $68,141, which is 45.6% below its all-time high of $125,251 on October 6. Looking at the logarithmic chart, the renewed effectiveness of the head-and-shoulders formation (last seen in 2022) means that the 7-year upward trend (red line) is now facing a major test. If the 4-year moving average and the trend line (both at around 57,800 points) hold, a continuation of the long-term upward trend is possible. Support for this scenario is provided by the MACD and RSI, which indicate extreme oversold conditions (green circles at the bottom). Otherwise, the downward trend would likely continue, in extremis to 17,500 points or lower.

Even gold does not grow on trees. The price of gold has almost doubled in the last twelve months and tripled in the last four years, a feat that previously took around 20 years, recently breaking through the US$5,000 per troy ounce mark. This is despite the fact that demand for jewellery and purchases by central banks fell sharply last year. The decline in demand was particularly pronounced in India (-24%) and China (-25%). Demand for jewellery in China fell to its lowest level in more than 15 years. Central banks purchased 863 tonnes of gold last year, around 20% less than in the previous year. The main driver of the rise in the gold price was investment demand, which rose by more than 70 per cent year-on-year in the fourth quarter of 2025. For the year as a whole, there was even an increase of more than 80 per cent to a record level of 2,175 tonnes, as published by the World Gold Council. The reasons for this record-high investment demand were a weaker US dollar, expectations of further interest rate cuts by the US Federal Reserve, concerns about a changing world order and, above all, speculation about higher gold prices. Investors' speculation about a higher gold price is reflected in extreme positioning in the derivatives markets, ... ... more on LinkedIn

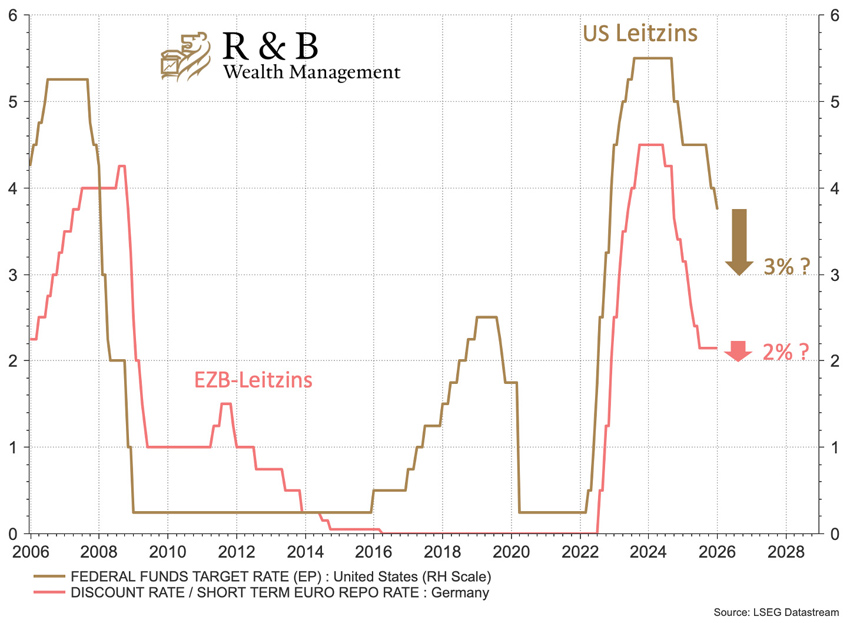
We do not expect any interest rate cuts from FED today. However, political pressure on the Fed will increase. The US dollar remains weak. We assume that the Fed will maintain its key interest rate corridor at 3.50-3.75%, as inflation is still above 2% and the labour market is showing only slight signs of weakness. The most interesting thing today will be whether and how Fed Chairman Jerome Powell will comment on the attacks on him personally and on the Fed's independence, and whether he will leave the Fed at the end of May or only step down as chairman of the FOMC and remain on the Board of Governors. If Powell remains defiant, the US dollar, which has come under heavy pressure recently, could benefit in the short term. The trigger for the recent weakness of the dollar was a remark made by US President Donald Trump to journalists: ‘The dollar is doing great.’ This triggered a wave of US dollar selling on the markets this week. With his statement, Trump emphasised that he welcomes a weak dollar – as he has done repeatedly in the past. We expect that the Fed will not be able to escape political pressure in the further course of the year and that, in addition to the two interest rate cuts expected by the market in the first half of the year (March and June), there will be a further interest rate cut in the second half of the year, which the market has not yet priced in. We therefore believe that the US dollar is likely to remain weak.
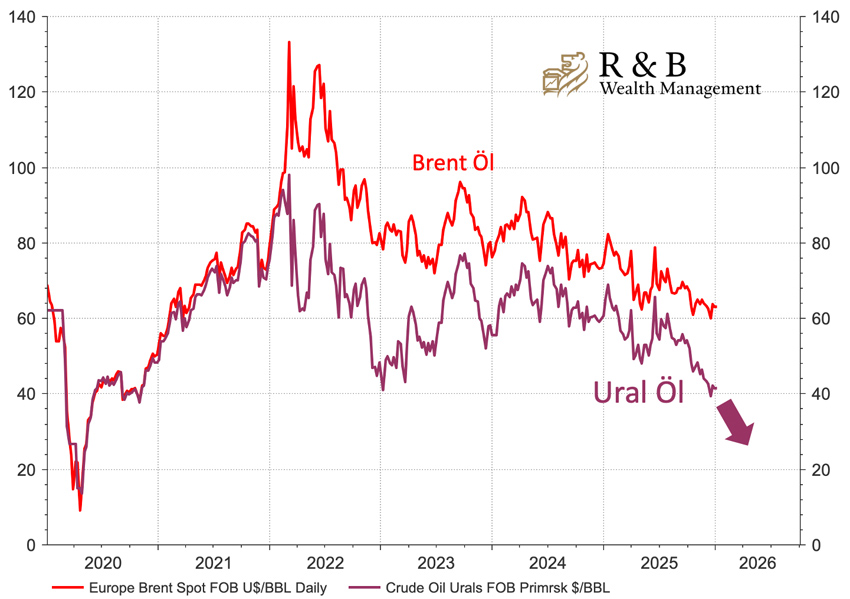
Russian oil prices have collapsed. Western sanctions and concerns that Venezuela will no longer repay its loans after Maduro's removal from power by the US are causing the Russian state increasing problems. Revenues from oil exports have recently fallen to their lowest level since Russia's full-scale invasion of Ukraine. ‘We are making it increasingly difficult for Moscow to sell its oil at reasonable prices,’ says EU sanctions chief David O'Sullivan. In fact, for weeks now, the country has been receiving a maximum of only $40 per barrel of crude oil exported (see chart), as little as during the coronavirus crisis, when energy demand plummeted. Currently, only $34.50 per barrel is being paid for oil exported from the Russian port of Novorossiysk. Russia's economy is in stagflation: the growth of recent years threatens to turn into recession...
If Hassett is nominated, we anticipate three interest rate cuts of 0.25 percentage points each by the US Federal Reserve in 2026. The term of Fed Chair Jerome Powell, who faces ongoing significant pressure from the US government to lower interest rates, ends in May of this year. If Donald Trump's obvious preferred candidate, Kevin Hassett, wins the race to succeed him, a third key interest rate cut could follow as a ‘welcome gift for Hassett’. We expect at least two interest rate cuts due to weakening labour market data.
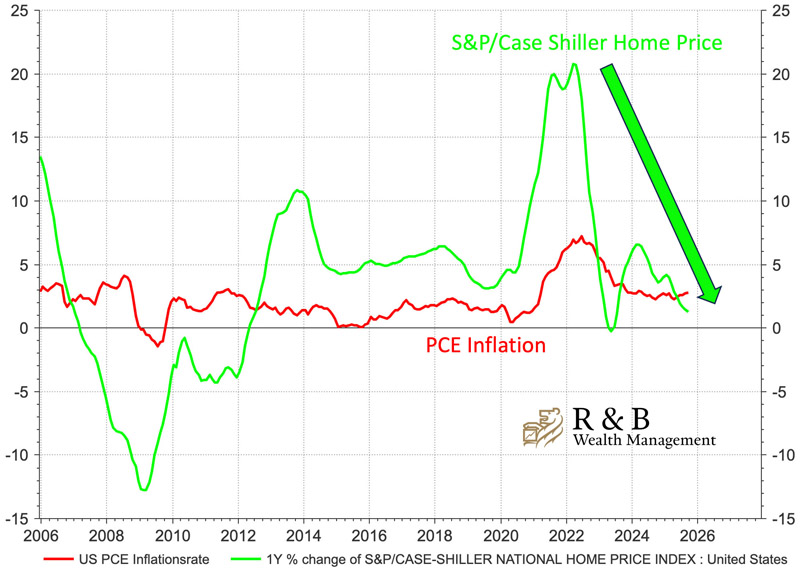
Green light for a US key interest rate cut of a quarter of a percentage point tonight, which would bring the key interest rate for overnight money down to between 3.50% and 3.75%. This comes against the backdrop of the Federal Reserve's most closely watched PCE inflation measure coming in lower than expected and the S&P/Case-Shiller U.S. National Home Price NSA Index, which calculates prices for single-family homes in the nine U.S. census districts, also falling significantly recently (green line). The core personal consumption expenditure index, which excludes volatile food and energy prices, rose by 0.2% month-on-month, while the annual rate stood at 2.8%. The monthly rate was in line with the consensus forecast of economists surveyed by Dow Jones, but the annual rate was 0.1 percentage points below...
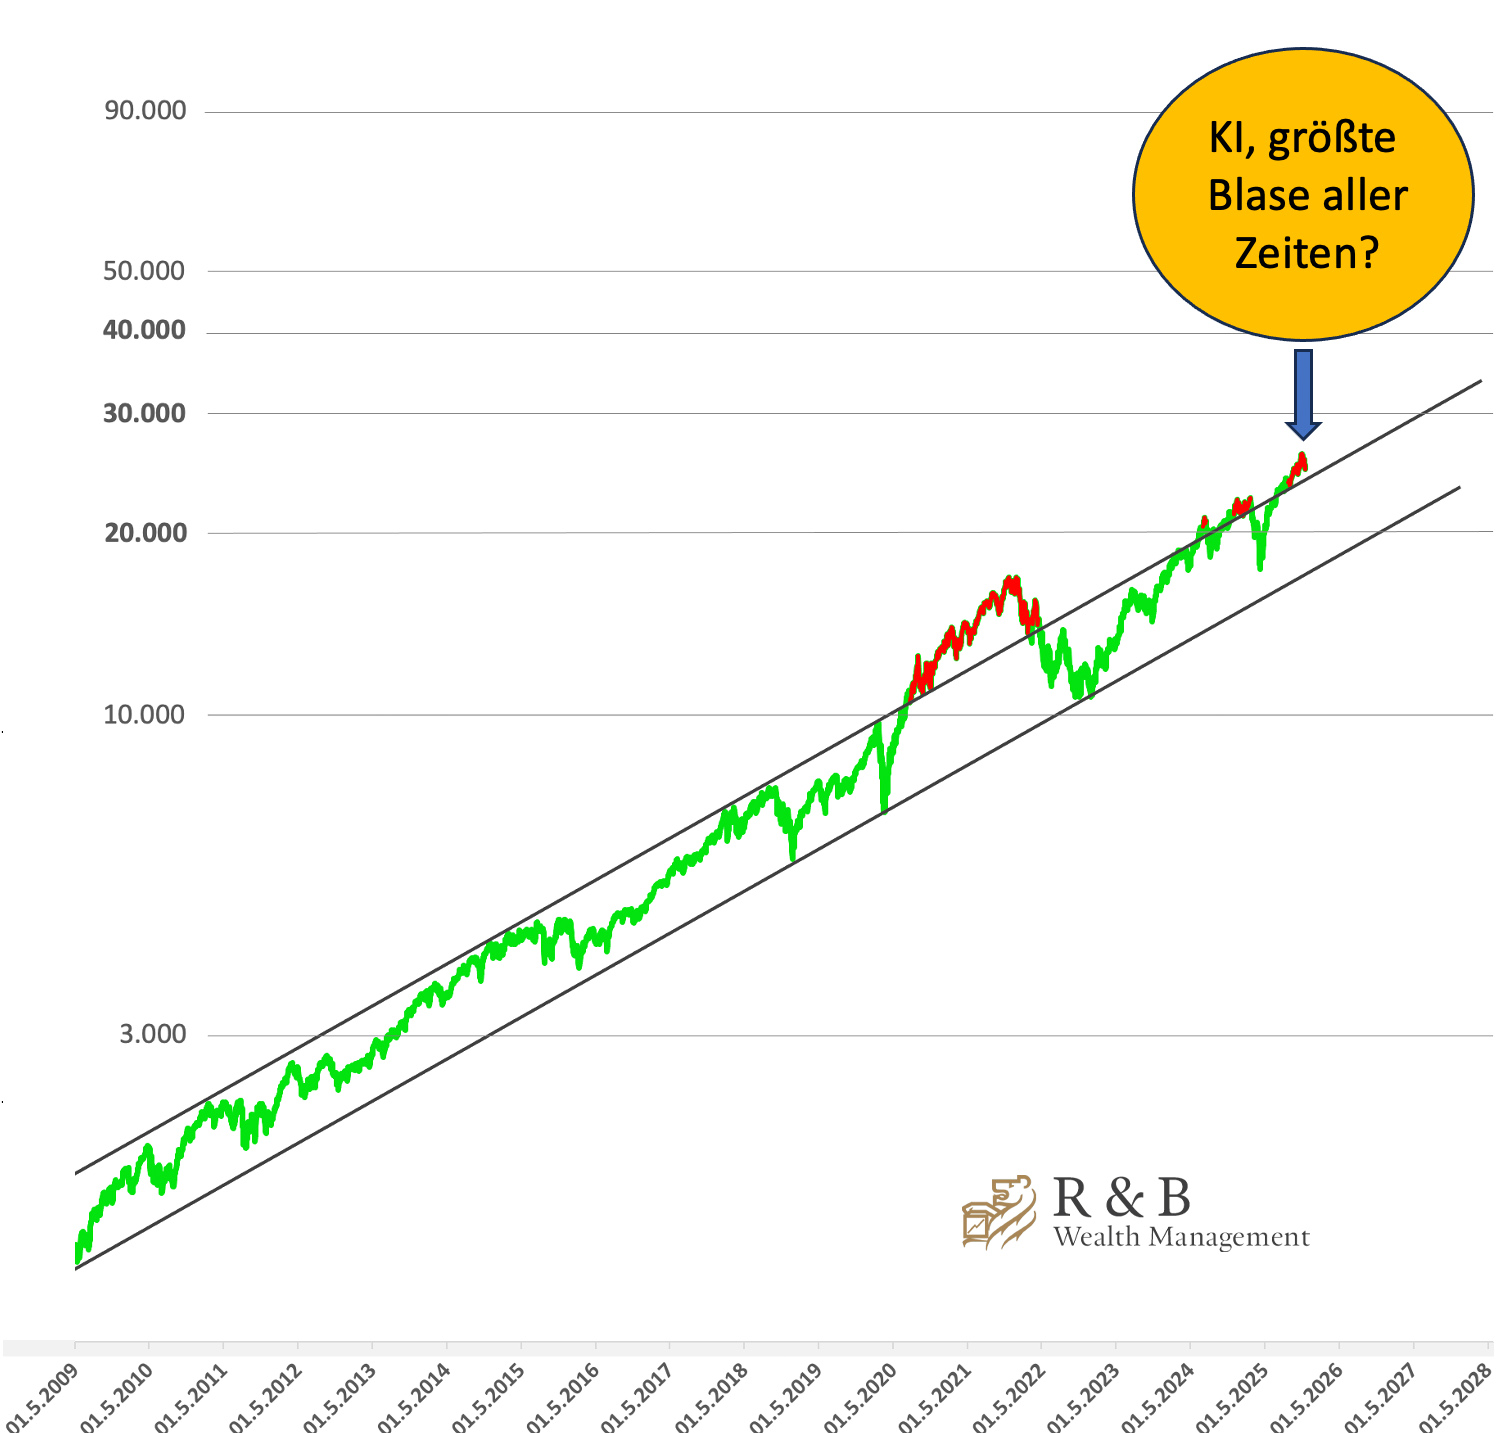
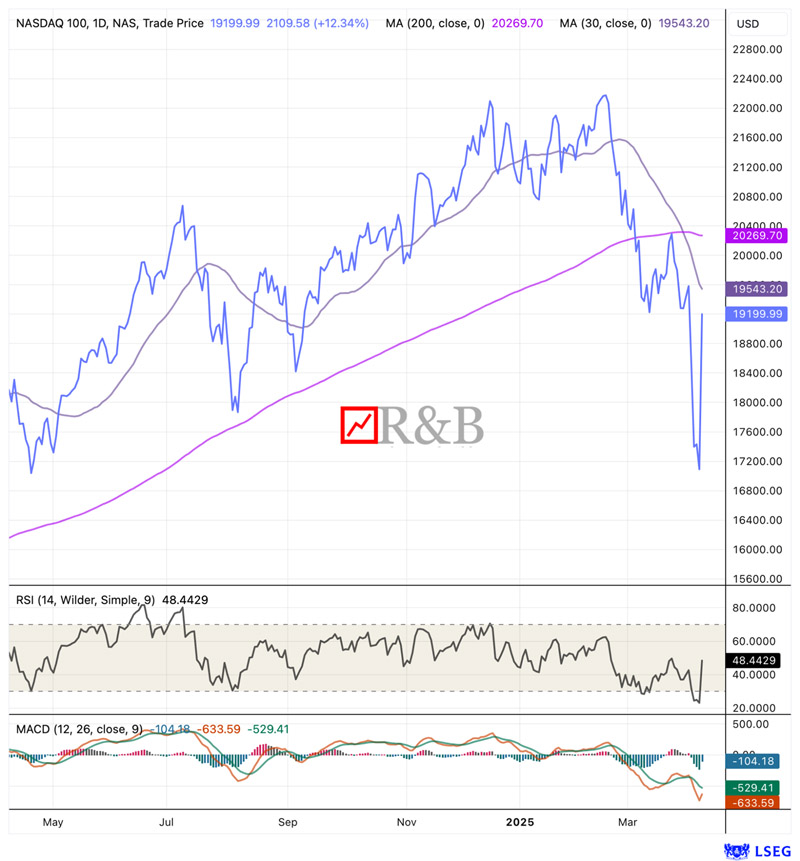
AI, the biggest bubble of all time, causing the Nasdaq to crash? A look at the logarithmic Nasdaq 100 chart illustrates that we are currently dealing with a significant overvaluation. A correction is therefore possible at any time. However, we do not foresee a crash with a fall below the lower trend line. Current corporate earnings and the sustained high demand for AI solutions, whose development is still in its infancy, are too strong. The alpha of the trend channel's slope corresponds almost exactly to the long-term average ROE of the largest US technology companies.
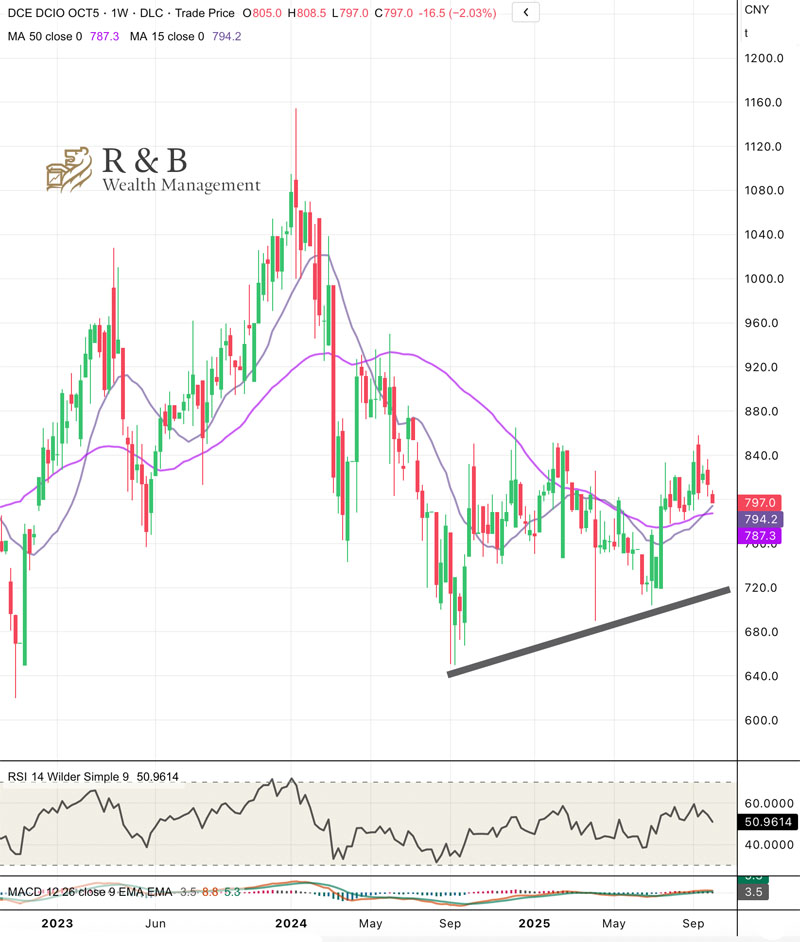
Chinese construction industry on the rise? Technical buy signal in Chinese iron ore futures. Iron ore, which is used to produce steel, accounts for 93% of all metals mined in 2024. Industrial metals such as copper and aluminum account for around 7%. Only 0.5% is accounted for by technology metals (e.g., tin, cobalt, lithium) and precious metals (gold, silver, platinum, palladium). Last year, 1.58 billion tons of iron were produced, ... Chinese iron ore futures have been recovering since their interim low in September 2024 and delivered a technical buy signal at the beginning of the month with a view to the 15/50 moving average. These futures also set the price for the global market.
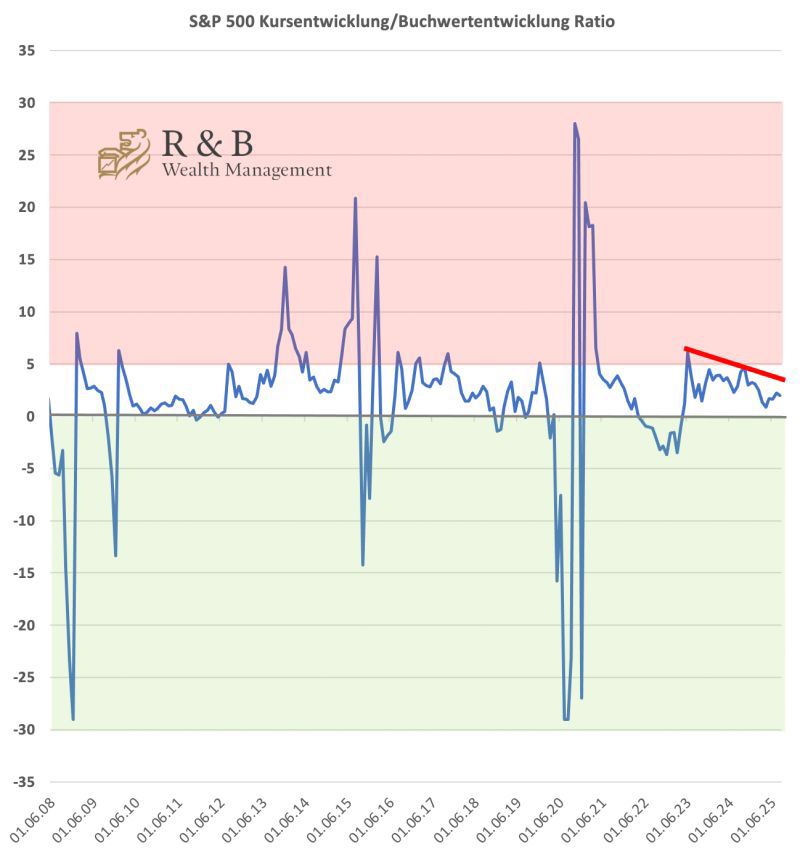
We have calculated the ratio of price performance to book value growth for the S&P 500 for the first time in order to (1) place the current values in a historical context and (2) identify possible areas of undervaluation and overvaluation. This was done against the backdrop of the current prevailing market opinion that US equities are now more expensive than ever before and that a market correction is inevitable. In fact, at 4.6, the current price-to-book ratio of the S&P 500 is similar to that at the peak of the New Economy bubble in early 2000. However, a glance at the chart shows that since the peak on 30 June 2023, there has been a decline in the ratio of price performance to book value growth (falling red line). In other words, book value growth has outpaced price performance over the last two years, with the S&P 500 reaching multiple all-time highs...

US hourly wages, another argument for a key interest rate cut in September. Average hourly wages for all employees in private US jobs outside agriculture rose by 3.9% in July 2025 compared to the previous year. This is the strongest increase in four months, following an upwardly revised increase of 3.8% in June. The figures exceeded market expectations of a 3.8% increase. However, looking at the chart, it can be seen that the rate of increase has almost halved from March 2022 (6.98%) to today (3.90%), providing further argument for a key interest rate cut in September 2025.
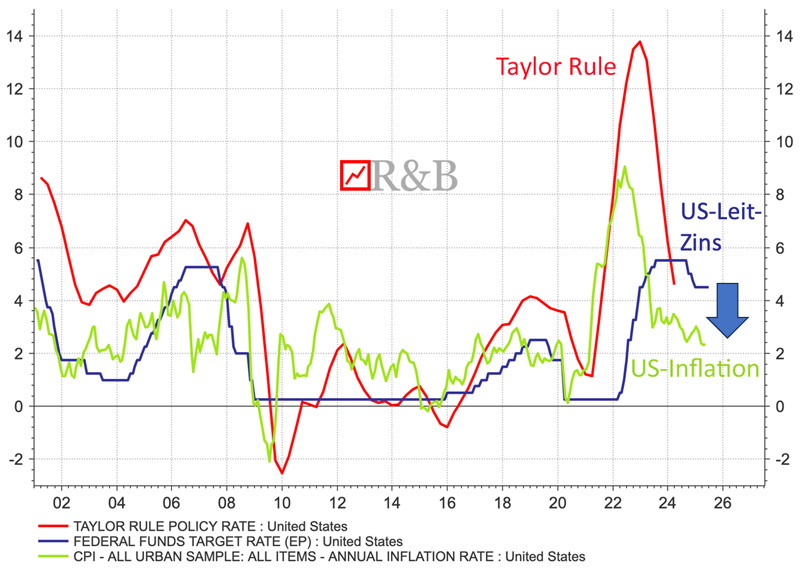
Taylor Rule and US interest rates are on a par. The Taylor Rule suggests lowering interest rates when inflation is below target or economic growth is too low. In view of the current inflation trend and the expected burden on US economic growth from US tariff policy, we see a high chance of a US interest rate cut of 0.50% in September.
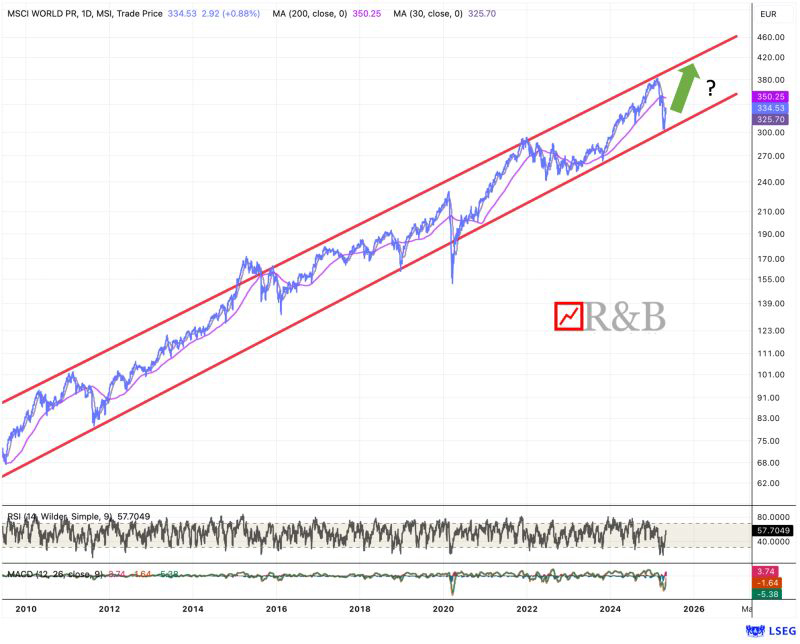
The bear market issue should be off the table now because the lower trend line of the logarithmized MSCI World Index has held. As we have repeatedly written here, in the media and to our clients, we see the market correction as an above-average opportunity for long-term asset accumulation. This is because “Trump's” customs madness has also produced positive aspects. The decline in exports to the US will cause prices in the eurozone to fall, which could create scope for additional interest rate cuts by the European Central Bank. In addition, the EU and Germany decided to spend record amounts on defense. In addition, the German Bundestag has approved a significant expansion...
Nasdaq 100 on track for biggest daily gain in 24 years. This came on the back of the news that Trump is putting the reciprocal tariffs on hold for 90 days.

US tariffs, an unprecedented overreaction? Everyone can decide for themselves whether a stock market correction on the level of the Covid crisis is justified by looking at the chart, which shows the NON-US export ratios (red figures/orange bars) of the ten largest US exporters, which account for 80% of the total US import volume (the countries in brackets have been added to the EU). For example, Germany's US export volume is only 10.9% (USD 163 billion). Accordingly, 89.1% is exported to other countries. The two US neighbors Mexico and Canada, which have concluded separate trade agreements with the USA, were excluded from the comparison.

Very strong technical buy signal. Trump has enabled the relative strength index (RSI) of the MSCI World Index EUR to hit a five-year low. As the chart shows, the RSI is currently 18.37 points, even lower in oversold territory than during the coronavirus crisis (19.40). Nevertheless, the chances of a technical rebound (recovery) are now very high. In light of this, the US interest rate cut we expect in March, the EU's largest armaments programme in generations, which was recently approved, and the reconstruction fantasy in Ukraine in the event of an end to the war, we currently see a good opportunity to add to equities...

The chart illustrates very impressively the ten times higher volatility of Bitcoin compared to equities. Period last year. While Bitcoin was initially uncorrelated with equities, it has become increasingly correlated with equities in recent years. At the 75,000 level, Bitcoin is again attractively valued for us from a technical perspective.

Despite one DAX record after another, the price-to-book value ratio (P/BV) is only rising moderately. The book value is a measure of the equity lying dormant in the balance sheets of DAX companies and currently stands at 13,150 index points. The P/B ratio of the DAX currently stands at 1.66 and is therefore only slightly above the 10-year average of 1.59. In our scenario, the DAX's P/B ratio has a good chance of remaining between 1.6 and 1.8 given the prospect of further falls in ECB interest rates, growth in the M3 money supply (up 3.4% in the past 12 months), the weak euro, which benefits many DAX companies with strong exports, an expected DAX dividend yield of 3.1%, which is 70 basis points higher than the yield on 10-year German government bonds, and a global economy that is picking up again with robust growth in the US and China. At the current DAX book value, this would correspond to a DAX in the range of 21,040 to 23,600 points.

China's economy delivered. GDP grew by 5% in 2024, exceeding expectations and reaching the official annual target. As the chart shows, growth was primarily driven by exports. In the fourth quarter, new economic stimulus measures also supported consumption. This year is likely to be more difficult. The threat of US tariffs and the declining willingness of other countries to allow Chinese goods into the country unchecked are likely to cause the export engine to stutter. In addition, the downturn on the property market is not yet over. The government wants to maintain the pace of growth with new economic measures and improved implementation...

EUR/USD heading for parity or countermovement? Following disappointing economic data, the euro has continued its recent slide and reached its lowest level in two years at 1.0411 US dollars. After slipping below the support area of 1.0463, the path towards parity appears to be clear. In the short term, however, technical indicators such as RSI, MACD and moving averages with their ‘strongly oversold’ signals point to a counter-reaction. The S&P Global Purchasing Managers' Index for the eurozone fell...

According to the early morning analyses of many projection models, Trump will clearly win the US election. The Republicans will also win a majority in the Senate.
After Donald Trump recently called for the US President to be involved in decisions made by the Federal Reserve and exerted pressure on the US central bank during his first term in office, the prospect of a steeper US interest rate cut should stimulate the economy and thus support the US stock markets...
This report can also be read in the Vorarlberger Nachrichten of 7 November 2024.

The S&P 500 Index is in a weaker position than the Dow Jones Index (DJI). If Donald Trump were to win the election, the technology-orientated S&P 500 Index (Microsoft, Google, Apple, Nvidia and Tesla account for over a third of the total return) would benefit more than the DJI. However, the upside potential of the S&P 500 Index is much more limited compared to the DJI due to its currently high valuation. See chart. If there is a change of government next week, the so-called ‘Trump trade’ would take centre place. Trump stands...
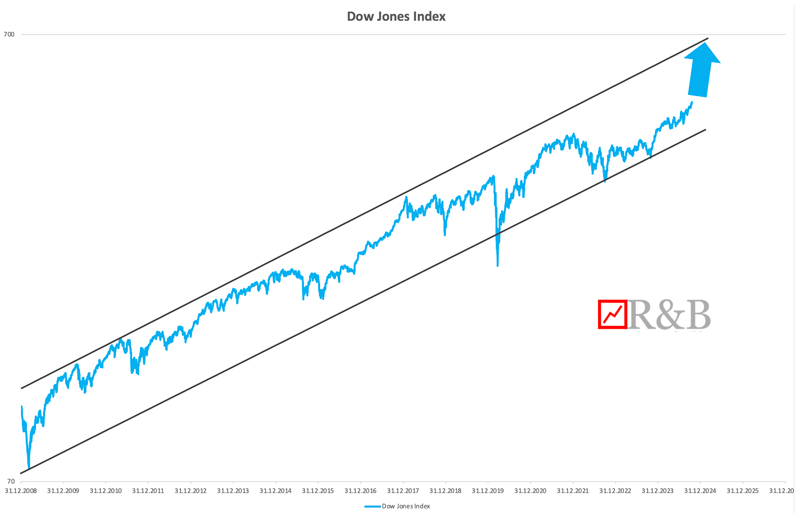
Good starting position. Dow Jones Index ready for a big jump if Kamala Harris wins the election. Four years ago, Biden was exactly the right man to redeem the USA and the world from Donald Trump's excessive activism. His domestic political track record was remarkable. At a time of deep political polarisation, he pushed several important programmes through Congress. Under him, the repair of the ailing US infrastructure was tackled and the return of industry was initiated. If Kamala Harris, for whom Biden has cleared the way, wins the US election, we predict a sharp rise in the Dow Jones Index...

This September is a tough one. The US labour market data will follow tomorrow, Friday. We expect the US unemployment rate to remain unchanged at 4.3%. The next meeting of the ECB Governing Council will take place on 12 September. We are expecting a key interest rate decrease of 0.25%. Shortly afterwards, on 18 September, the Fed is scheduled to make its next interest rate decision. Our assumption is a rate reduction of 0.50%. If the interest rate forecasts are met, we expect a slightly weaker USD, a new all-time high for the DAX and a test of the historic highs of the DJI and S&P 500 in the face of high volatility - but only on a USD basis.
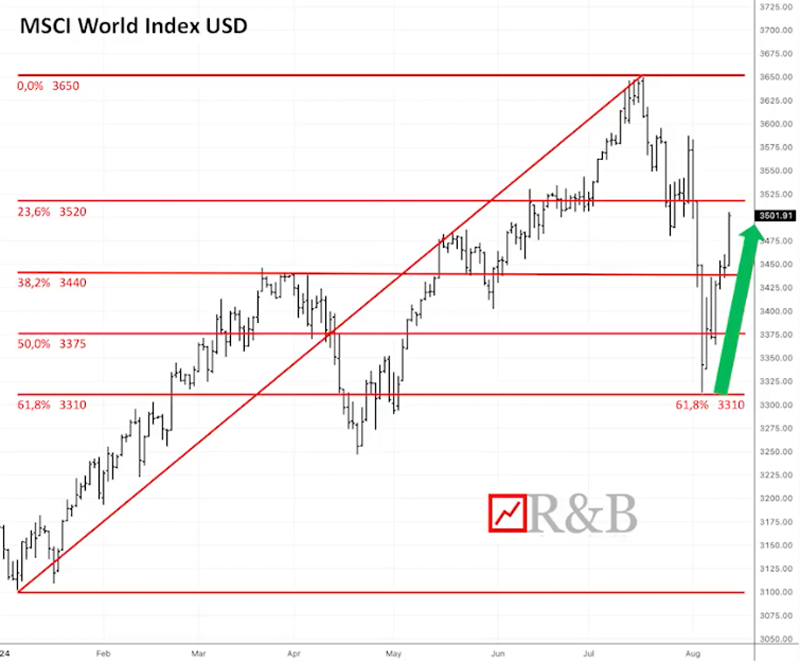
Our study tour takes us to Pisa, the birthplace of Leonardo da Pisa - alias Fibonacci - one of the most important mathematicians of the Middle Ages. An infinite sequence of numbers was named after him, which has some interesting mathematical aspects and is also frequently found in nature. Fibonacci retracements are often used in chartanalysis. The example of the MSCI World Index USD shows that the most current correction only found support at the 61.8% retracement mark. Technical corrections are rarely so intense in such a short space of time.

Markets rightly in crisis mode? US dollar breakout unsuccessful (for now?). Following a disappointing US labour market report, the markets are expecting the Fed to cut interest rates in crisis mode, by as much as 50 basis points in September and November. But is it appropriate that the stock markets are in crisis mode? A weakening of the US labour market was, after all, the Fed's goal...

Ten-year US yields below 3% expected. The Fed's favourite inflation indicator with respect to its 2% target, the PCE price index, sent contradictory signals in April. The data suggested that the high pace of price increases could continue for longer than expected, but also that declining consumer spending could dampen price increases in the coming months...

The Fed has singled out wages and salaries as one of the five most important variables in deciding whether it can cut interest rates and end its fight against high inflation. The Fed is of the belief that wage growth of around three per cent is in line with the inflation target of two per cent. US hourly wages recently rose - lower than expected - to 3.9 per cent...

Following our positive forecast on 12 January, the Nikkei rose from 33,700 points to round about 41,000 points before entering into a corrective downtrend. The day before yesterday it recorded an 8-week low at 36,754 points. At this support area (resistance area from 23 January to 8 February), the index formed a bullish doji candle in the hourly chart with extremely oversold technical market indicators...

US inflation is better than it looks. The Fed's preferred inflation measure, the PCE (personal consumption expenditures price index), is currently at 2.4%, much closer to the Fed's 2% target than the CPI (3.2%). The main reason for this divergence is residential property, which accounts for more than 30% of the CPI but only around 15% of the PCE. If the CPI index is adjusted for housing costs, it stands at 1.8% year-on-year and is therefore below the 2% target.

US key interest rates are two percent too high. The chart illustrates the interest rates set by the FED and calculated according to the Taylor rule from 2001 to 2024. If we check the interest rates for 2024, the orange line is lower than the blue line. According to the Taylor rule, interest rates should be lower than they are. Currently, a Taylor Rule target rate (formula and values below) of 3.45% can be calculated, which is shown in the chart.

Incredible: If the long-term trend of the Nasdaq 100 (shown logarithmised) continues, 30,000 points (+72%) could be on the upside of the trend channel by the end of 2026, and 20,000 points (+15%) on the downside. We therefore continue to be (not only about this) positive about our R&B NEXT Active Technology Fund.
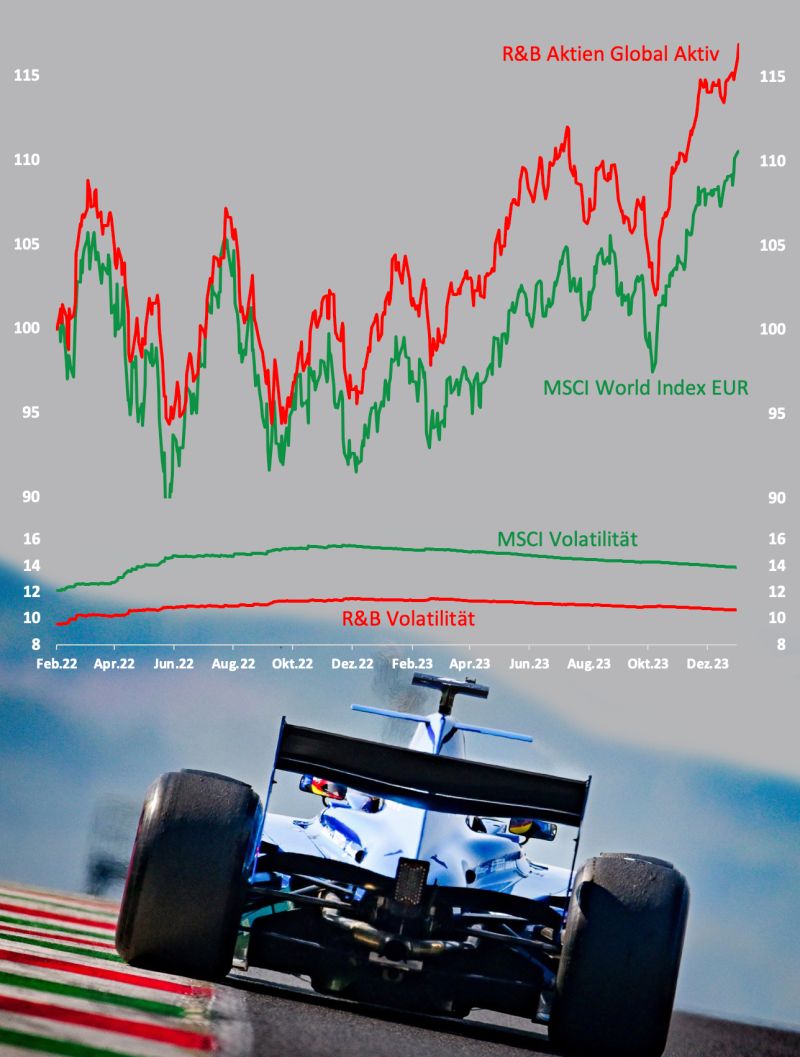
R&B Equity Global Activ Fund continues to perform well in terms of performance and volatility * R&B is the winner of the Austrian Fund of Funds Award from GELD-Magazin. Conservative equities category. Period 3 years.
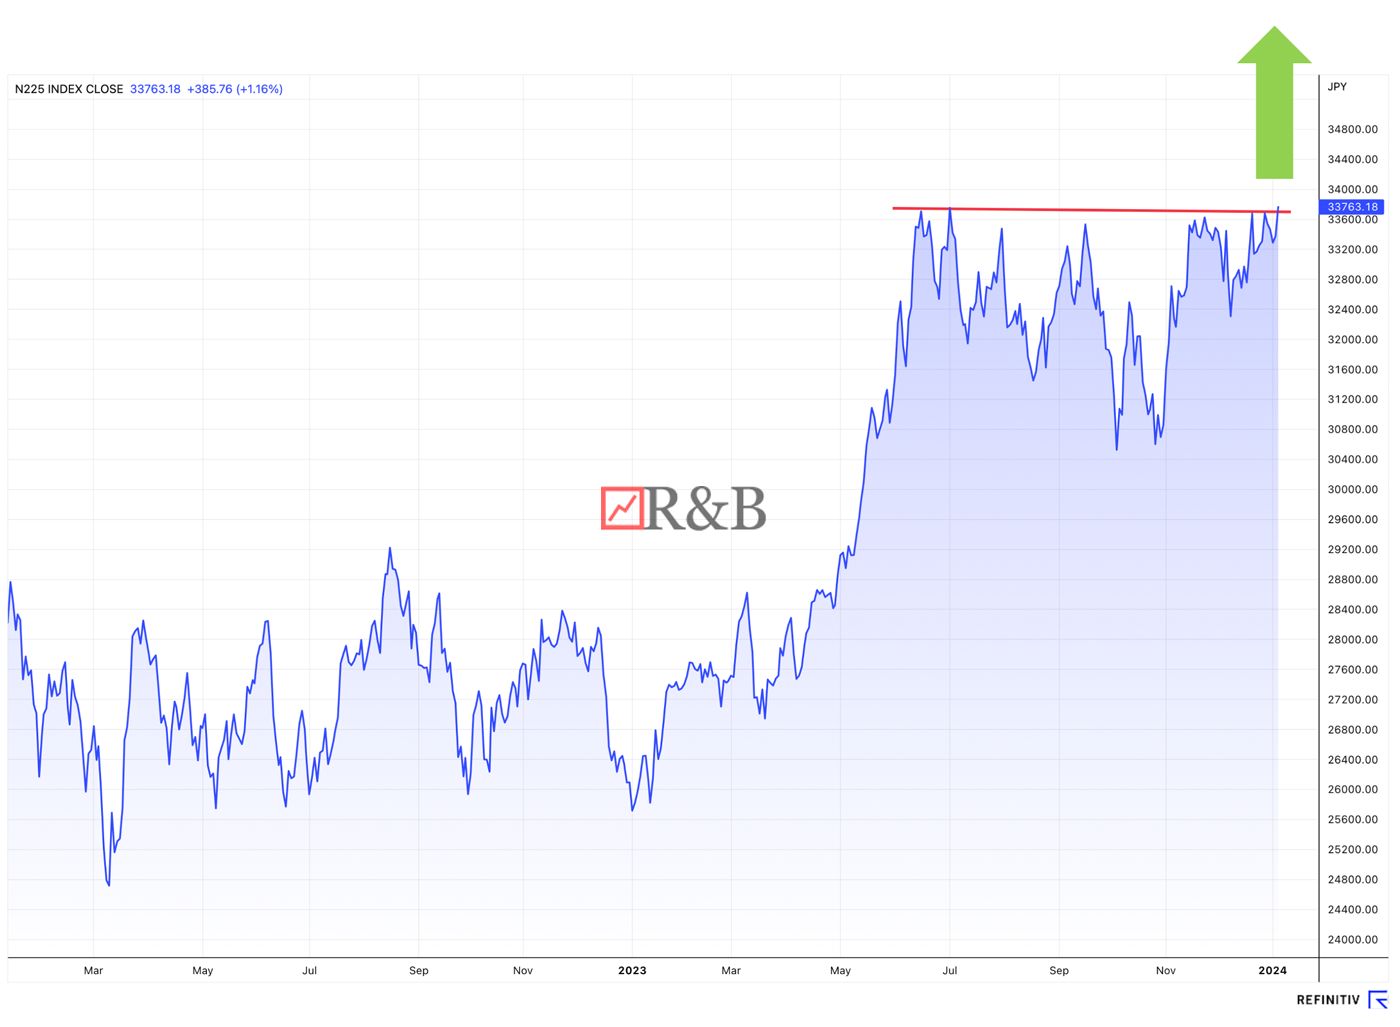
Nikkei gives a technical buy signal after breaking through the 33,700 resistance line. This is supported by the RSI (14), STOCHRSI (14), MACD (12.26), ADX (14), CCI (14) and ROC.
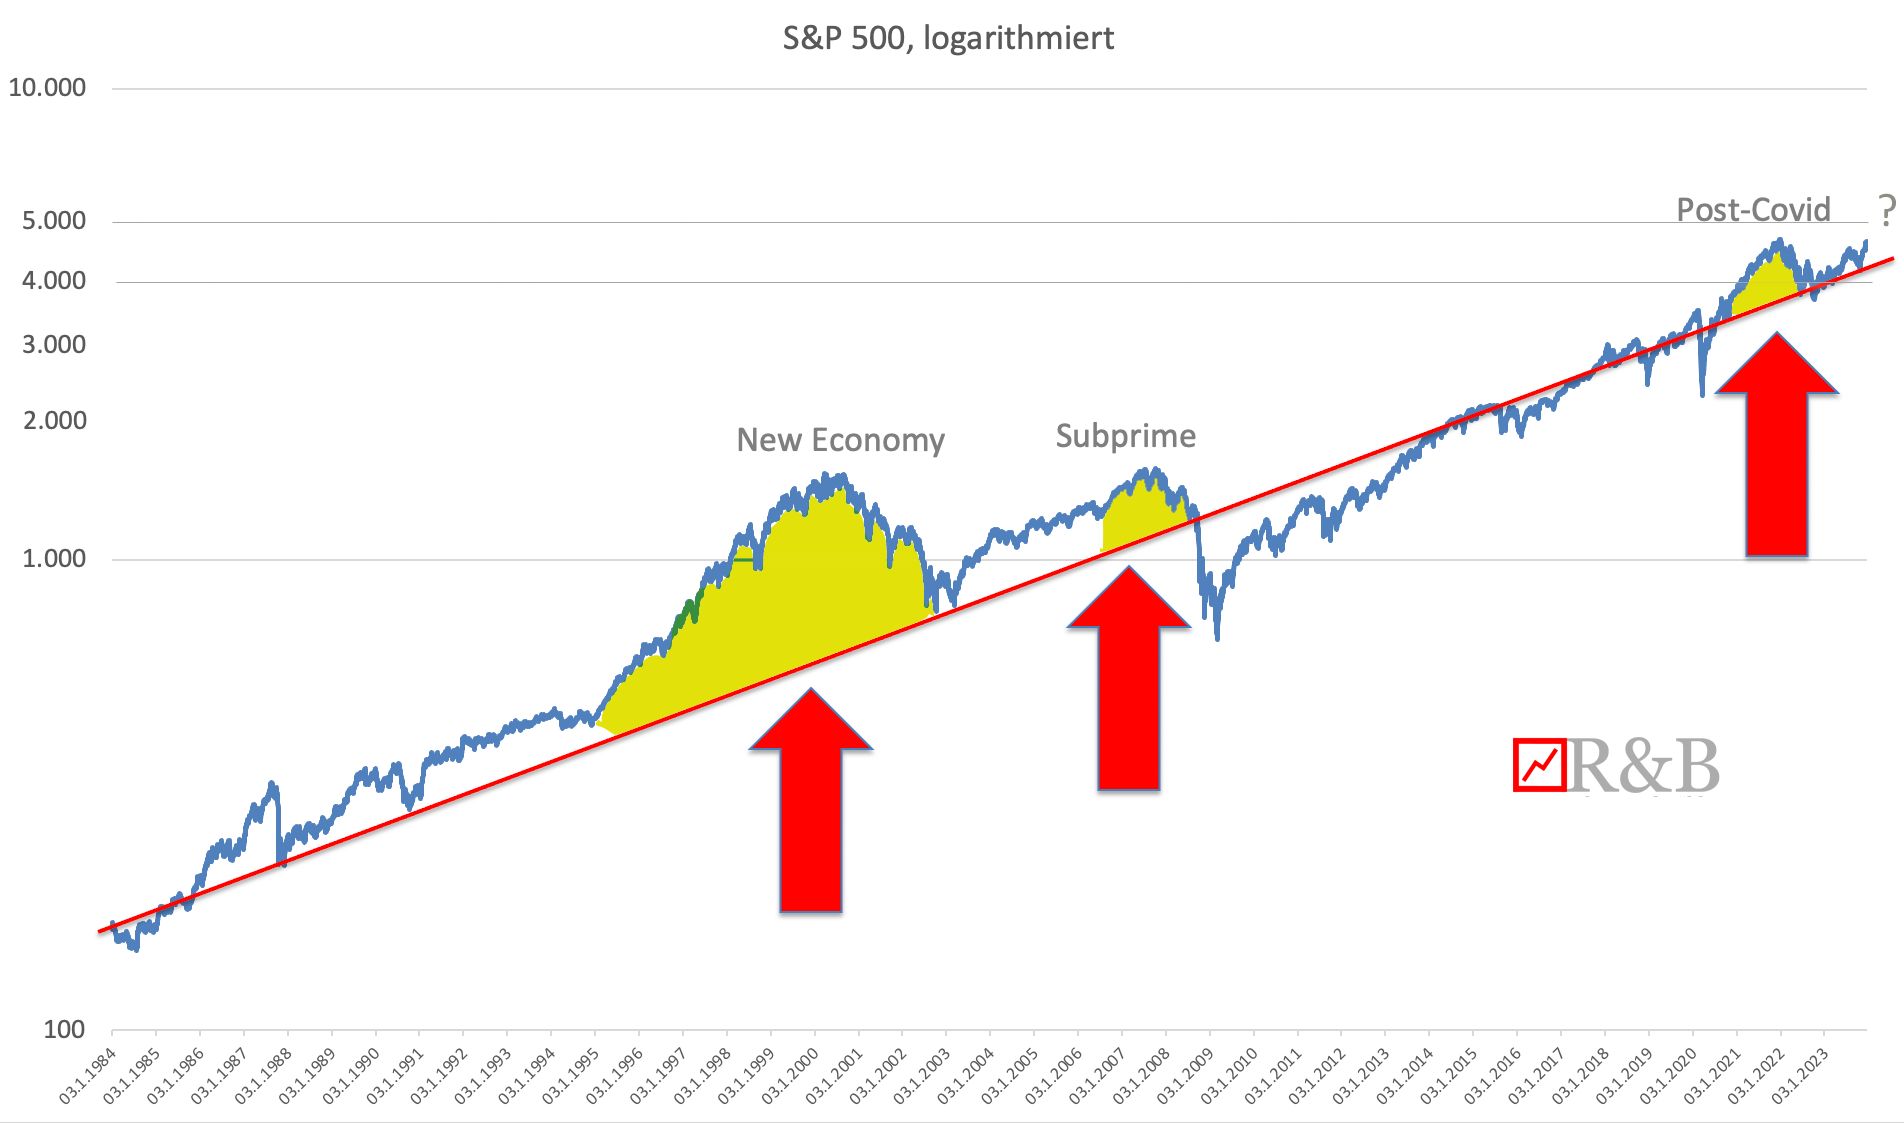
The logarithmised S&P 500 chart illustrates very well those phases that have risen above the level of the long-term trend. As can be seen, a rapid rise to 5,000 points or more today would initiate a new bubble. Since 2000, the S&P 500 has achieved an annualised total return of 7%, which is clearly below the average return on equity of the S&P 500 companies. For example, the average ROI in 2012 was 15 percent and then rose to 20 percent by 2022. Translated with DeepL.com (free version)
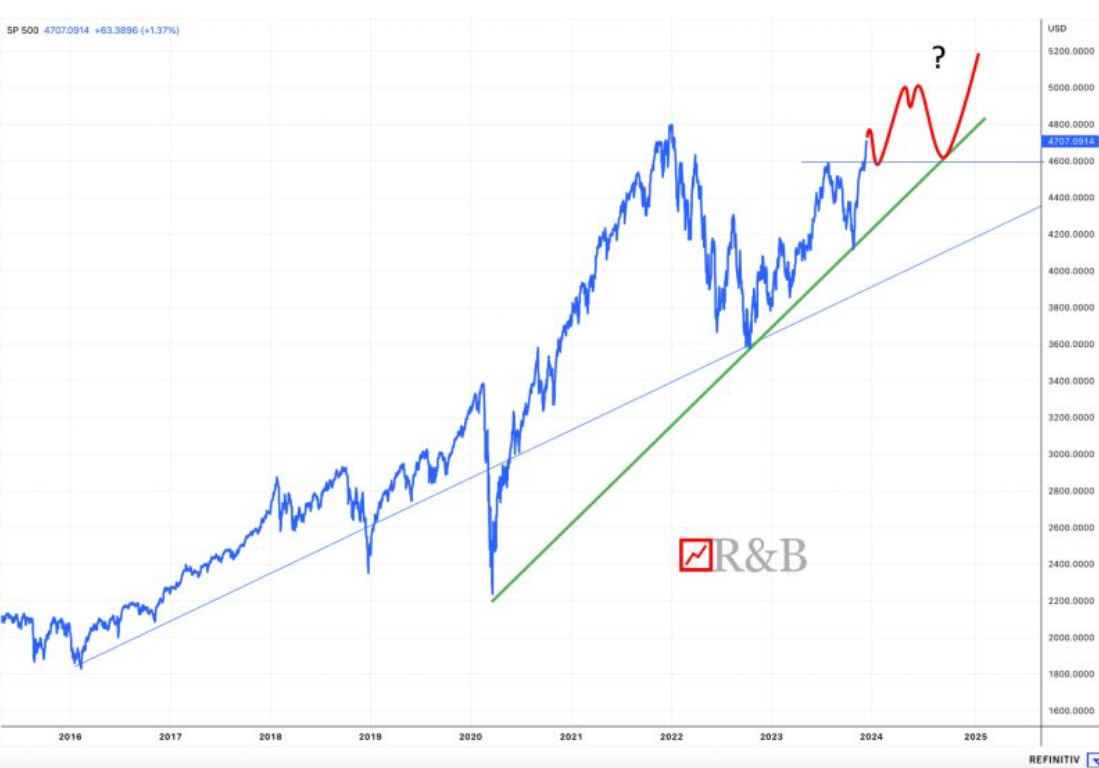
S&P 500 hangs by a thread: The overbought situation in the indicators (momentum/sentiment/market breadth) is not yet affecting price action, but a further rise in prices is hanging by a thread. The probability of a consolidation or correction to correct the overheating is high...
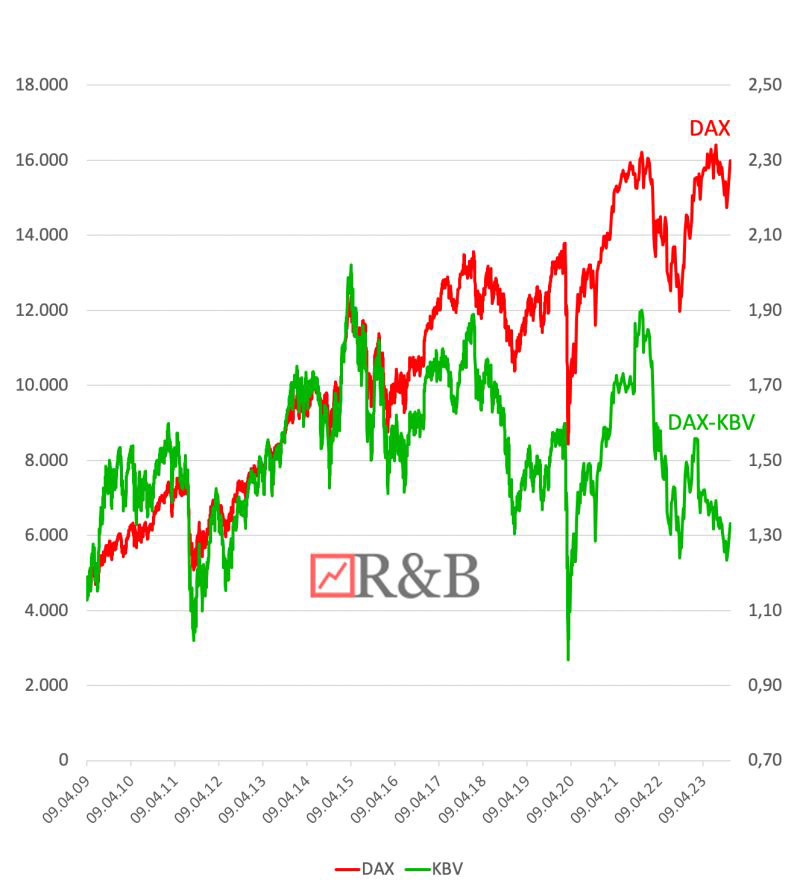
Even just below its all-time high, the DAX is underpriced in terms of his P/B ratio. At 1.38, the current DAX P/B ratio is well below the 20-year average of 1.61. An increase in the DAX P/B ratio to this average value would allow the DAX to reach 19,300 points if the DAX book value remains unchanged.
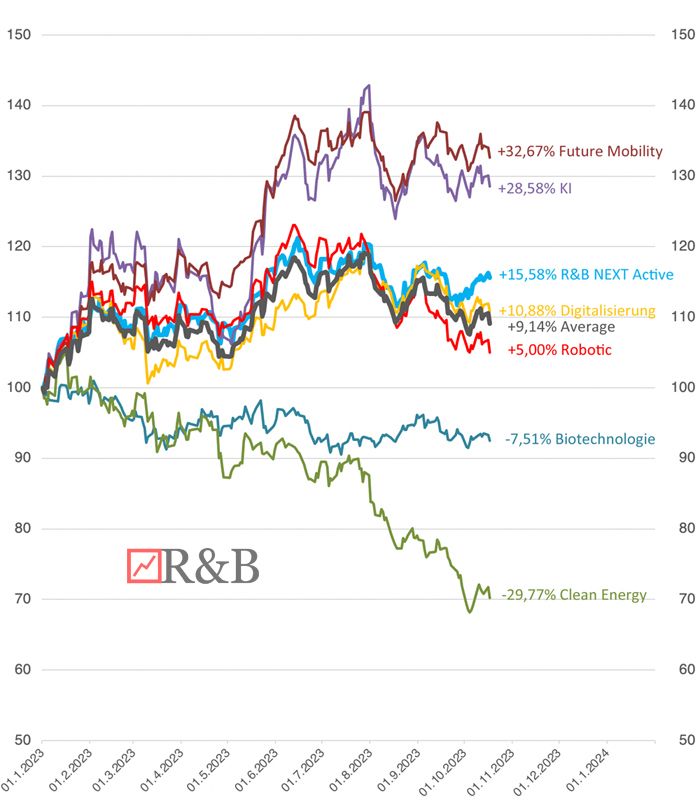
Our long-term favourite megatrends have performed significantly differently this year. Future mobility and artificial intelligence have performed very well. Digitalisation and robotics/automation also performed well...
US 10-year real yields recently climbed to their highest level in almost twenty years, bringing US equities and the euro to their knees. Both broke through the...
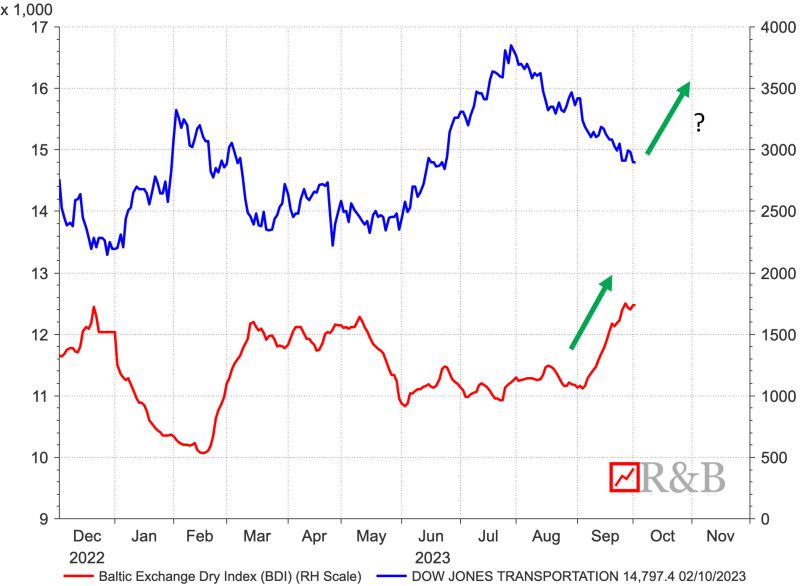
The Baltic Dry Index is regarded as an important early indicator for the global economy. The price index for freight rates on the world's oceans climbed to an annual high in September. Is this a buy signal?
R&B among the top 3 in Austria. Fondsprofessionell Magazin September 2023: "Number three in the top seller list delivered a real surprise: This is where the R&B Aktien Global Aktiv...

The Negative Return on Investment of a War – Russia Case Study
The Negative Return on Investment of a War – Russia Case Study

US Record Yields at the Long End
30-year US Treasury yield at 5.18% – highest level since 2007: Bear steepening, term premiums, and the consequences for bond and equity investors

After the latest technology leap, the future of the automobile is electric
800-volt architecture, batteries and SiC semiconductors: who benefits from the 2026 EV ramp-up – and can the German manufacturers catch up?

Gold and Silver in Freefall Despite the Iran War. As we predicted.
What is the Outlook for Gold and what should Investors do now?

The start of the Iran war put pressure on the markets, but didn't cause panic
Our recommendations for investors

Even gold doesn't grow on trees
The question is not whether gold is in a bubble, but when it will burst.

The stock market traffic light remains green
Our positive assessment is based primarily on the expected development of corporate profits.

Trump tariffs: hectic action is not advisable
We continue to see good opportunities on the stock market

Correction after FED meeting as an investment opportunity
FED expects slightly higher inflation in 2025

Trump Trade?
After the election of Donald Trump, we are favouring US equitiesien

Equity Market Outlook
Strategy and assessment H2 2024: We are positive on the technology sector. In the equity markets, we have overweighted the USA and Germany...

New all-time highs for Gold and Bitcoin
Whats next?

Outlook Equity
Interest rate cut fantasies boost stock markets

Outlook Equity
Falling inflation rates, positive economic growth, a low unemployment rate and only moderate wage growth...

Cause and consequences of the SVB collapse
The demise of Silicon Valley Bank was not caused by credit problems...

Investing in artificial intelligence?
In recent years, incredible progress has been made in computer science and artificial intelligence (AI)...

Science at R&B
New modified Sharpe Ratio method from R&B CEO to create fund rankings with funds that have a negative excess return...